The irradiance simulation tool allows you to simulate the irradiance on roof or ground surfaces as well as on the modules.
After adding 3D objects to your project you can simulate the irradiance to see the impact the terrain and objects have on certain areas.
First you will have to draw a sensor grid, this rectangular area will define the zone in which calculations will take place. This can be done manually by selecting the “sensor grid” option or Automatically for a rooftop project by pressing “Auto sensor grid”.

To use it select “Sensor grid” and specify the start and endpoint for this rectangle.


Now we are ready to perform the simulation.
Select the “Simulation” option and a popup will open.

Here we will specify data for our simulation:
- Weather file: Here you can load a weather data file to use for the simulation we use the EPW format. These can be acquired for free on sites like https://energyplus.net/weather.
- Specify the amount of time you want to simulate, this can range from a day to a full year.
- Sensor grid boundary: Next you will have to select the sensor grid in which you want to perform this simulation. If only one is available this is automatically selected.
- Mode: Here you can specify where to simulate.
- Surface: this option will allow you to simulate on the ground or roof surface. You can specify the area covered for each point in the simulation by changing the “Sensor size”. You can also offset the height of this simulation by adding a value to the “Sensor offset height” option.
- Modules: with this option you can simulate the irradiance per module. Optionally you can also select the amount of horizontal and vertical cells per module. This will impact the color gradient.
There is also an additional option to simulate the shadows created by racks on the ground surface. For accurate results you can set the module transparency and ground reflection.
- Output: This last category allows you to change some visual settings as well as output options.
- Heat map visualization: choose between a solid or 45 degree hatch to visualize on the project.
- Output: Choose how the generated values should be displayed. As a percentage or kWh/m2
- Show values on the drawing: Unchecking this box will not display values on the project.
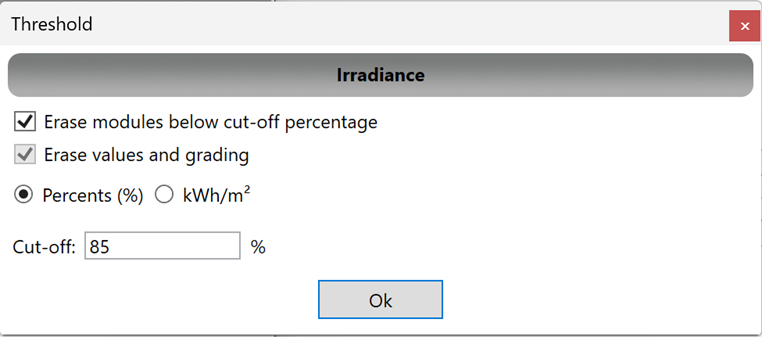
- Threshold: this option will open another window. Here you can specify a percentage or kWh/m2 below which modules should automatically be deleted to optimize your project. This also works for the surface option in which case the result will only show the areas with irradiance below that threshold to simulate the shadow area.
- Output XREF: Here you can choose to output the result as an external reference file instead of saved on the project itself. This might be used to gain some performance.
Now you can modify the range of the colours with the slider and press start to simulate.
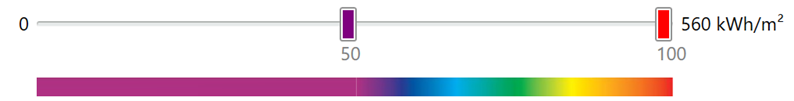
The result will display a value per sensor or module and a legend of the color values will be generated in the bottom right.
Surface


Module

