![White full logo.png]](https://help.virto.solar/hs-fs/hubfs/White%20full%20logo.png?height=40&name=White%20full%20logo.png)
Add consumption data
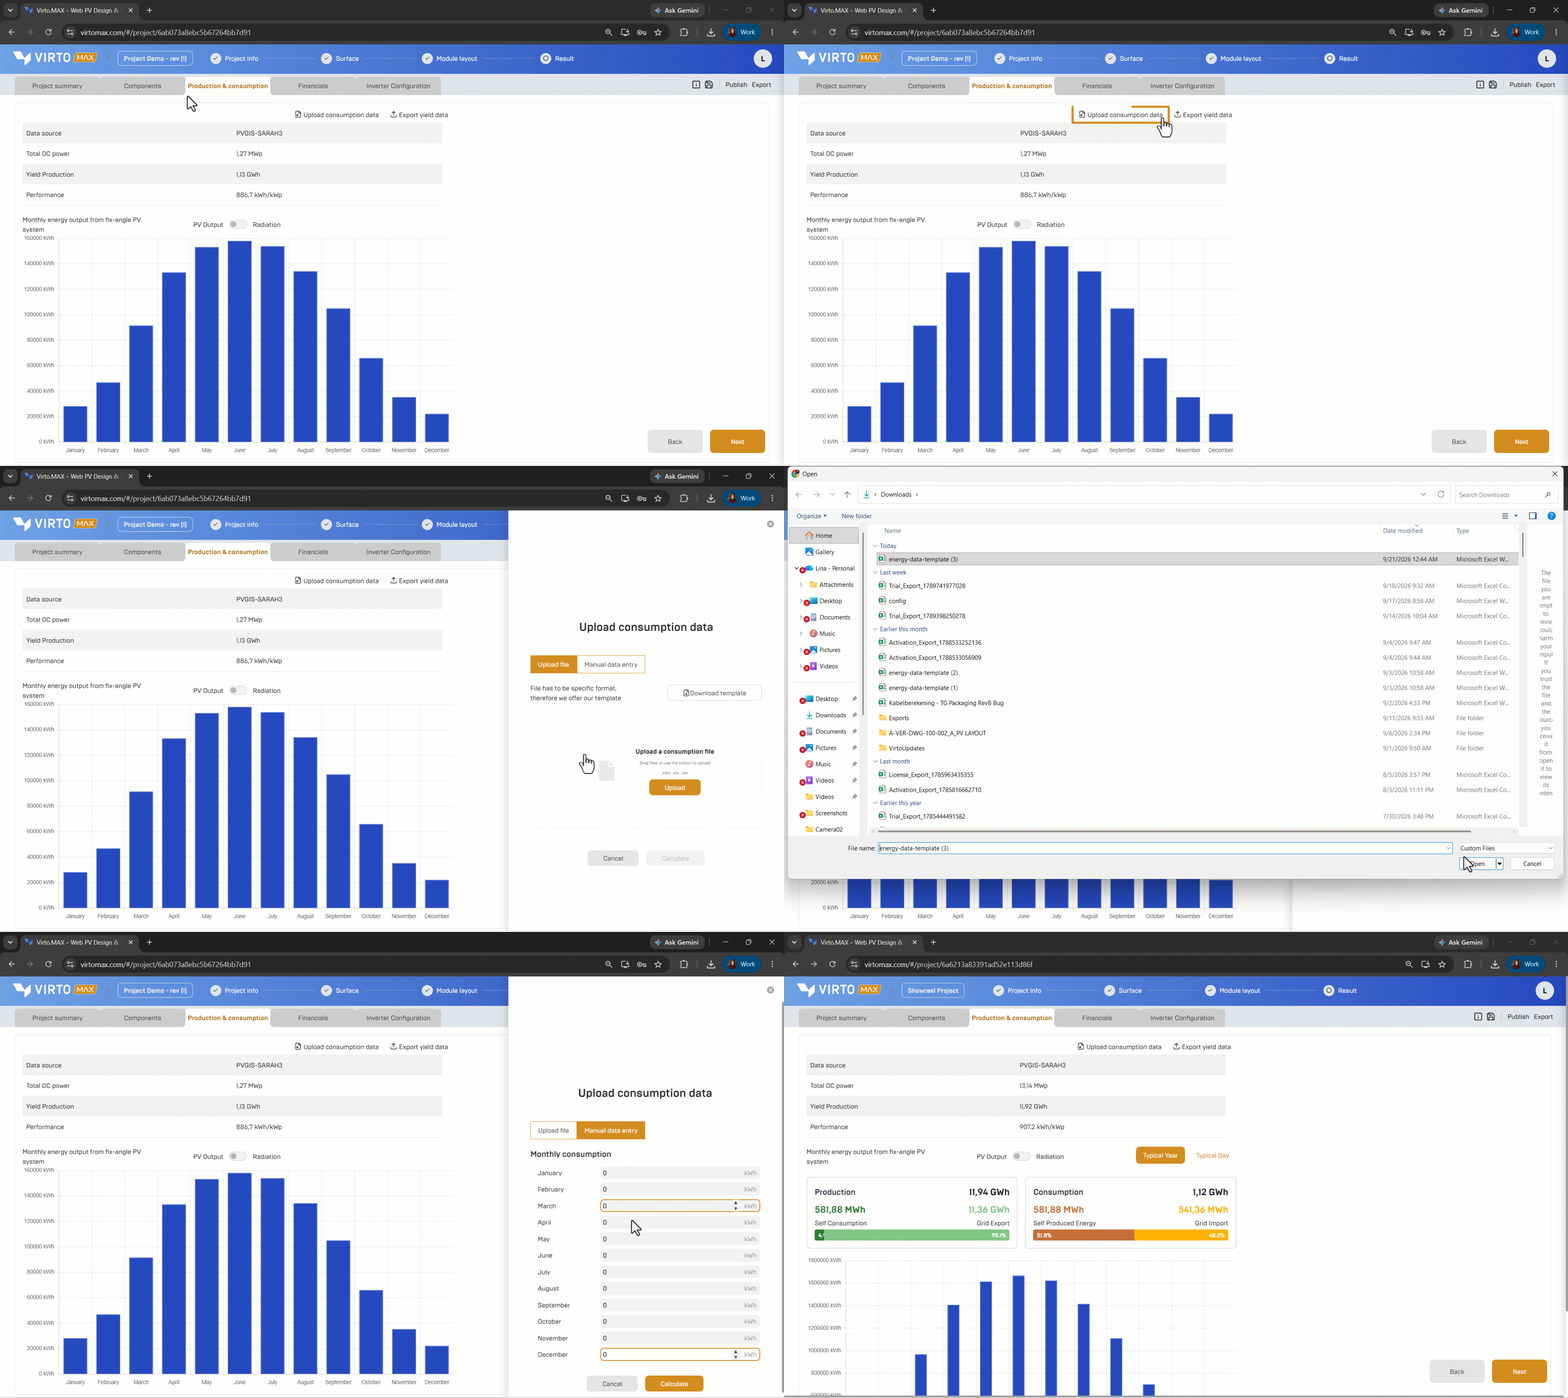
- Open the production-and-consumption section.
- Click on ‘upload consumption data ’
- Choose the available input method:
- Manual Data Entry: Enter monthly consumption totals for an initial estimate.
- Upload File: Upload an interval-based consumption file for a more detailed load profile. The file must be in .xlsx, .xls, or .csv format. Click Download template to get a compatible template and review how the data should be structured before uploading.
Review the analysis
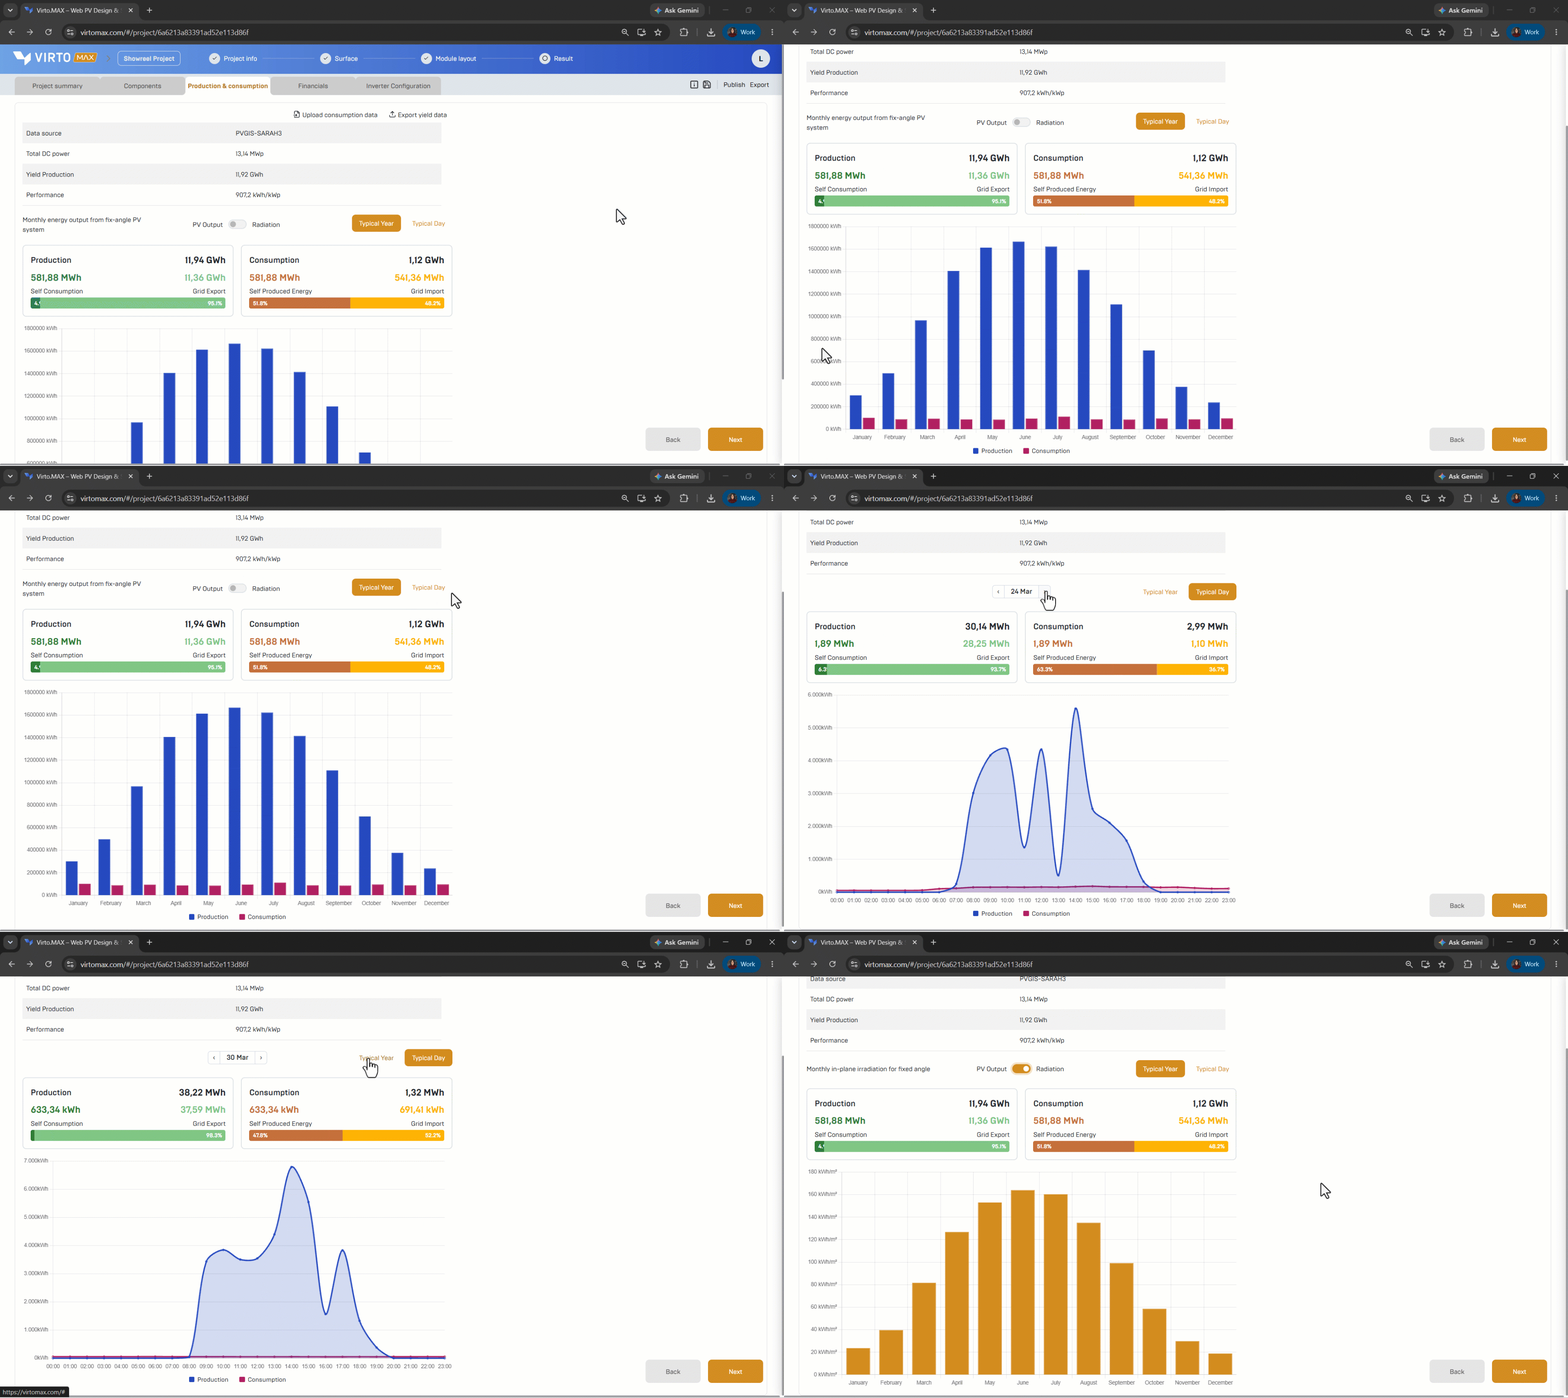
Use the daily and yearly charts to compare production and consumption. Depending on the input detail, the results can include:
- Total site consumption.
- PV energy used directly on site.
- PV energy stored in the battery system and used later.
- Energy injected into the grid.
- Energy imported from the grid.
- Self-consumption and self-sufficiency indicators.
- Peak demand and the timing of important load peaks.
Use the result
Compare different PV sizes or battery configurations to see how the energy balance changes. Include the relevant charts and metrics in the project report when sharing the business case with stakeholders.
Good to know: A complete interval profile is required for reliable hourly matching and peak-load analysis. Monthly values are suitable for a first estimate but cannot represent the timing of demand.
Next step: Create a financial model.