![White full logo.png]](https://help.virto.solar/hs-fs/hubfs/White%20full%20logo.png?height=40&name=White%20full%20logo.png)
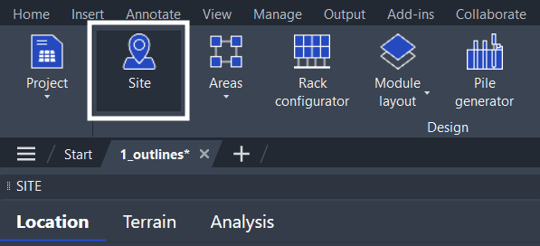
Select the Site feature, as shown below, to view the three main tabs: Location, Terrain, and Analysis.
Location
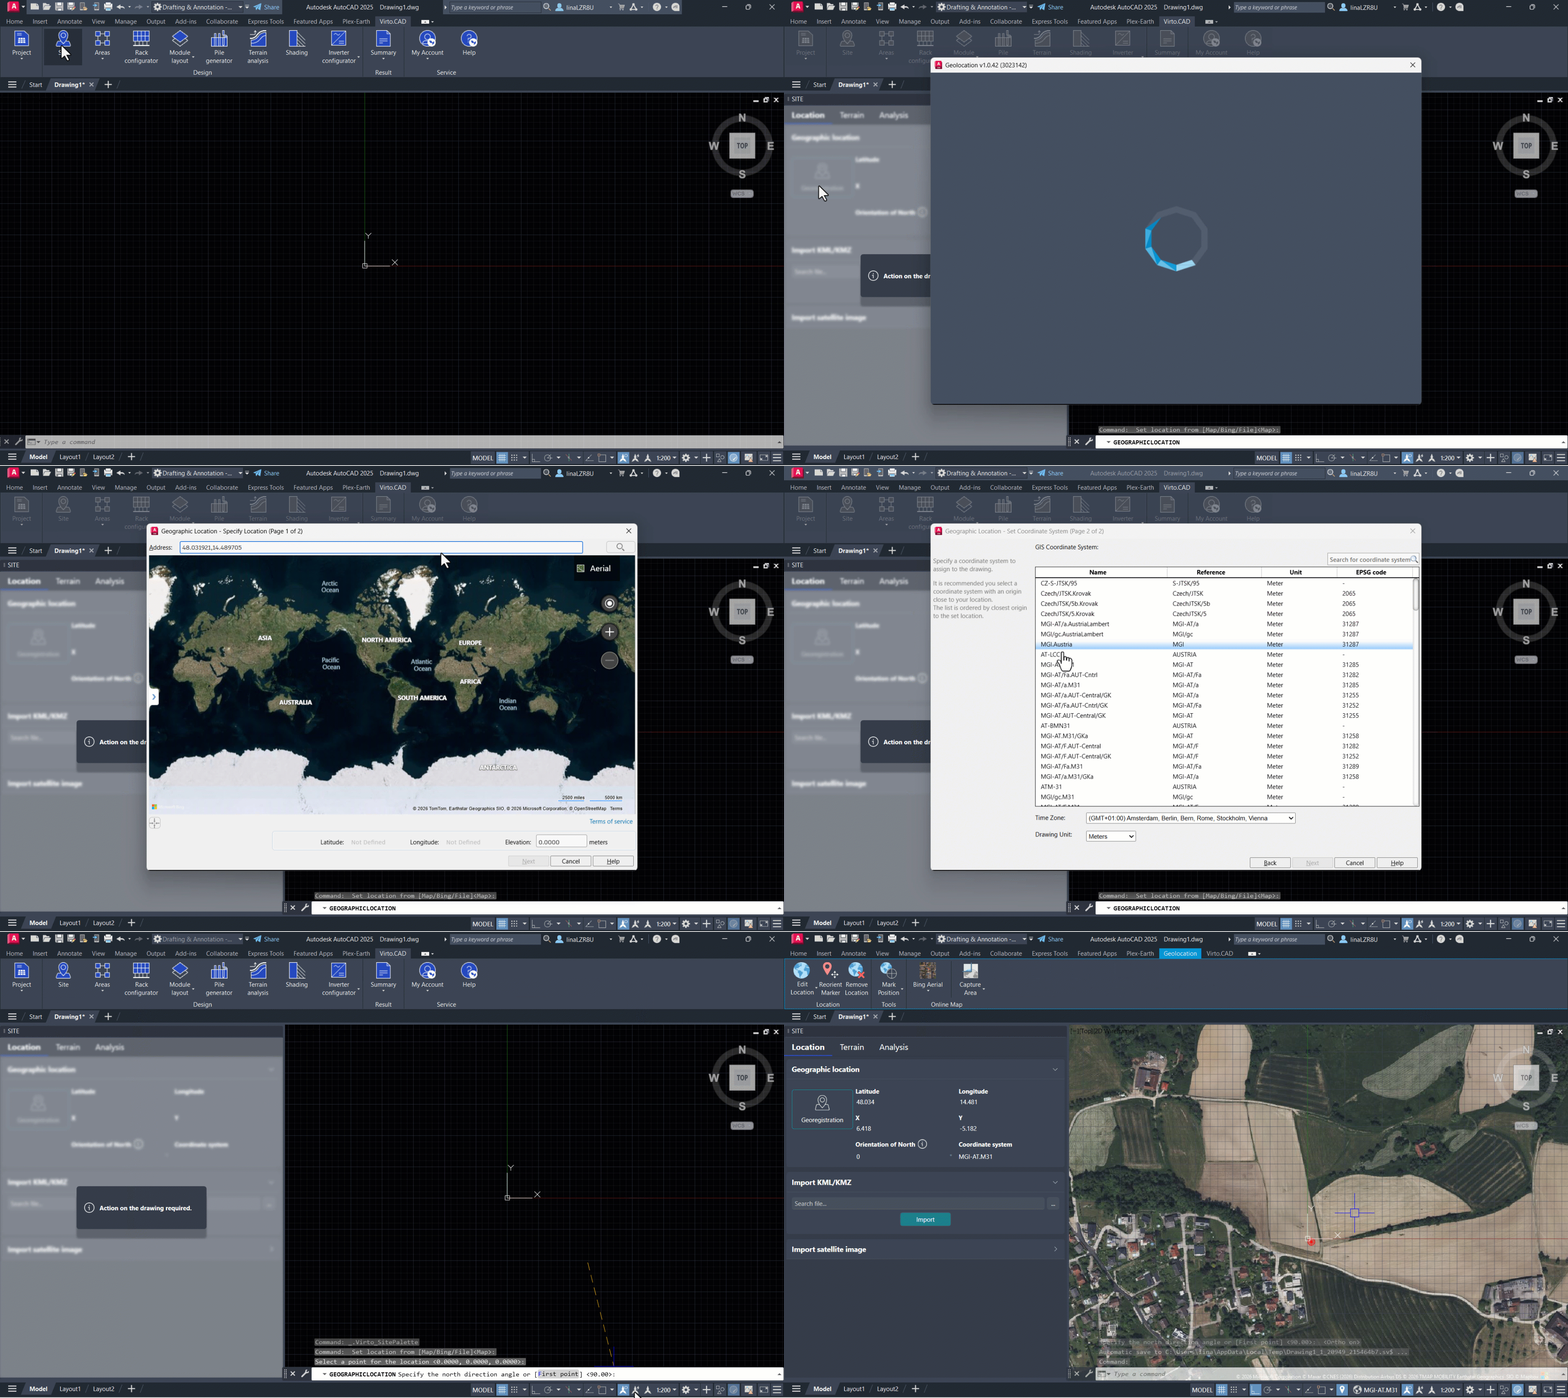
In the Location tab, you can geolocate your drawing. In the Geographic Location section, click Georegistration to open AutoCAD’s geolocation feature. From there, you can enter either an address or the coordinates for your project location. After placing the marker in the correct position, you will be prompted to select the coordinate system you want to use. When you click Next, the window will close, and you will be asked to choose the 0,0,0 point within your drawing space. Then, draw a straight line in the direction you want north to be.
Once this is defined, the imagery linked to AutoCAD will appear.
Another option is to upload a KML or KMZ file which you can do from the Import KMZ/KML option.
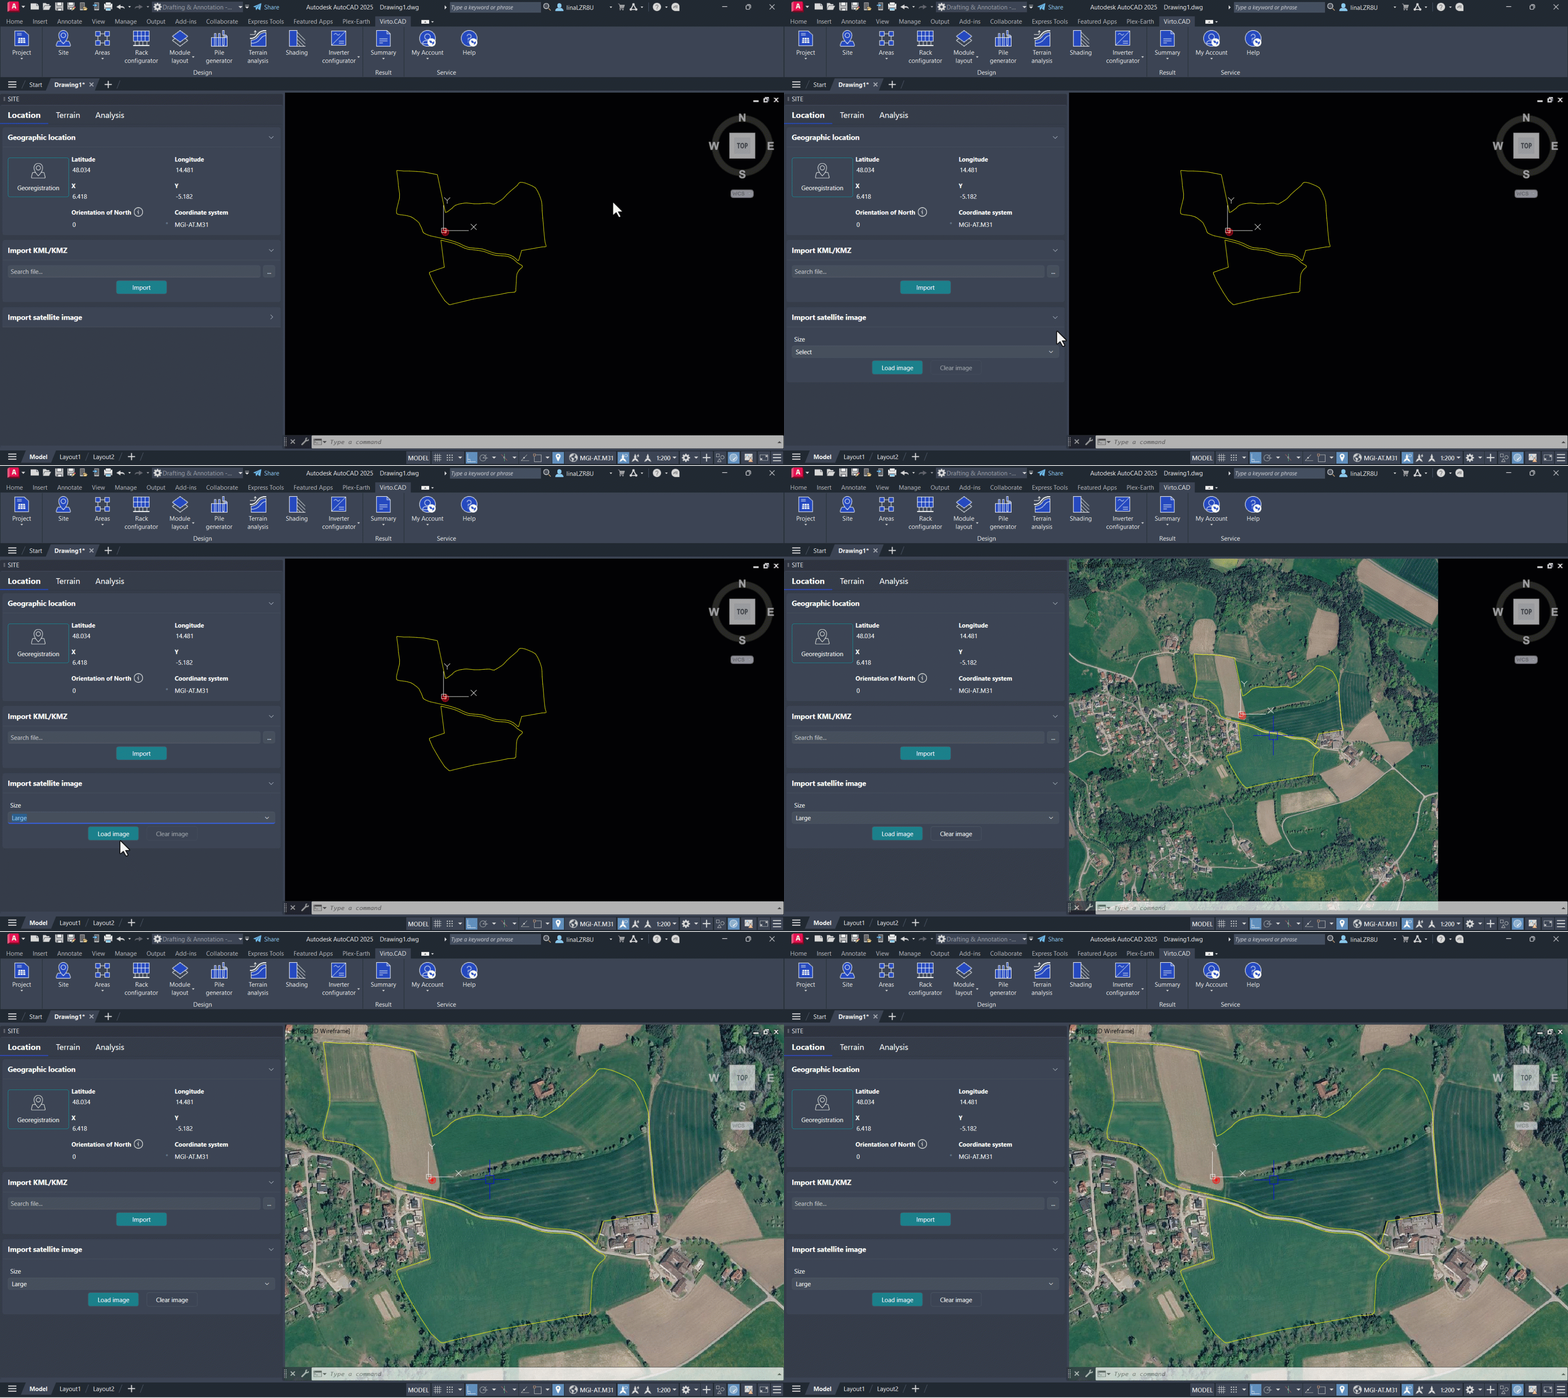
If your drawing is already georeferenced, you can also Import Satellite Image from the third section of the Location tab. Simply choose the image size you want to import and click Load Image. The image will appear instantly around the origin of your drawing.
Terrain
In the Terrain tab, you can Import Satellite Terrain by drawing a rectangle or polygon around the desired area, or by selecting an existing boundary if you have one.
The terrain is created as a mesh, which is required for building your design in Virto.CAD.
If you already have topography height lines available, you can also convert them into a mesh using the Convert Height Lines option. In this section, select the correct layer for your height lines and click Convert Terrain.
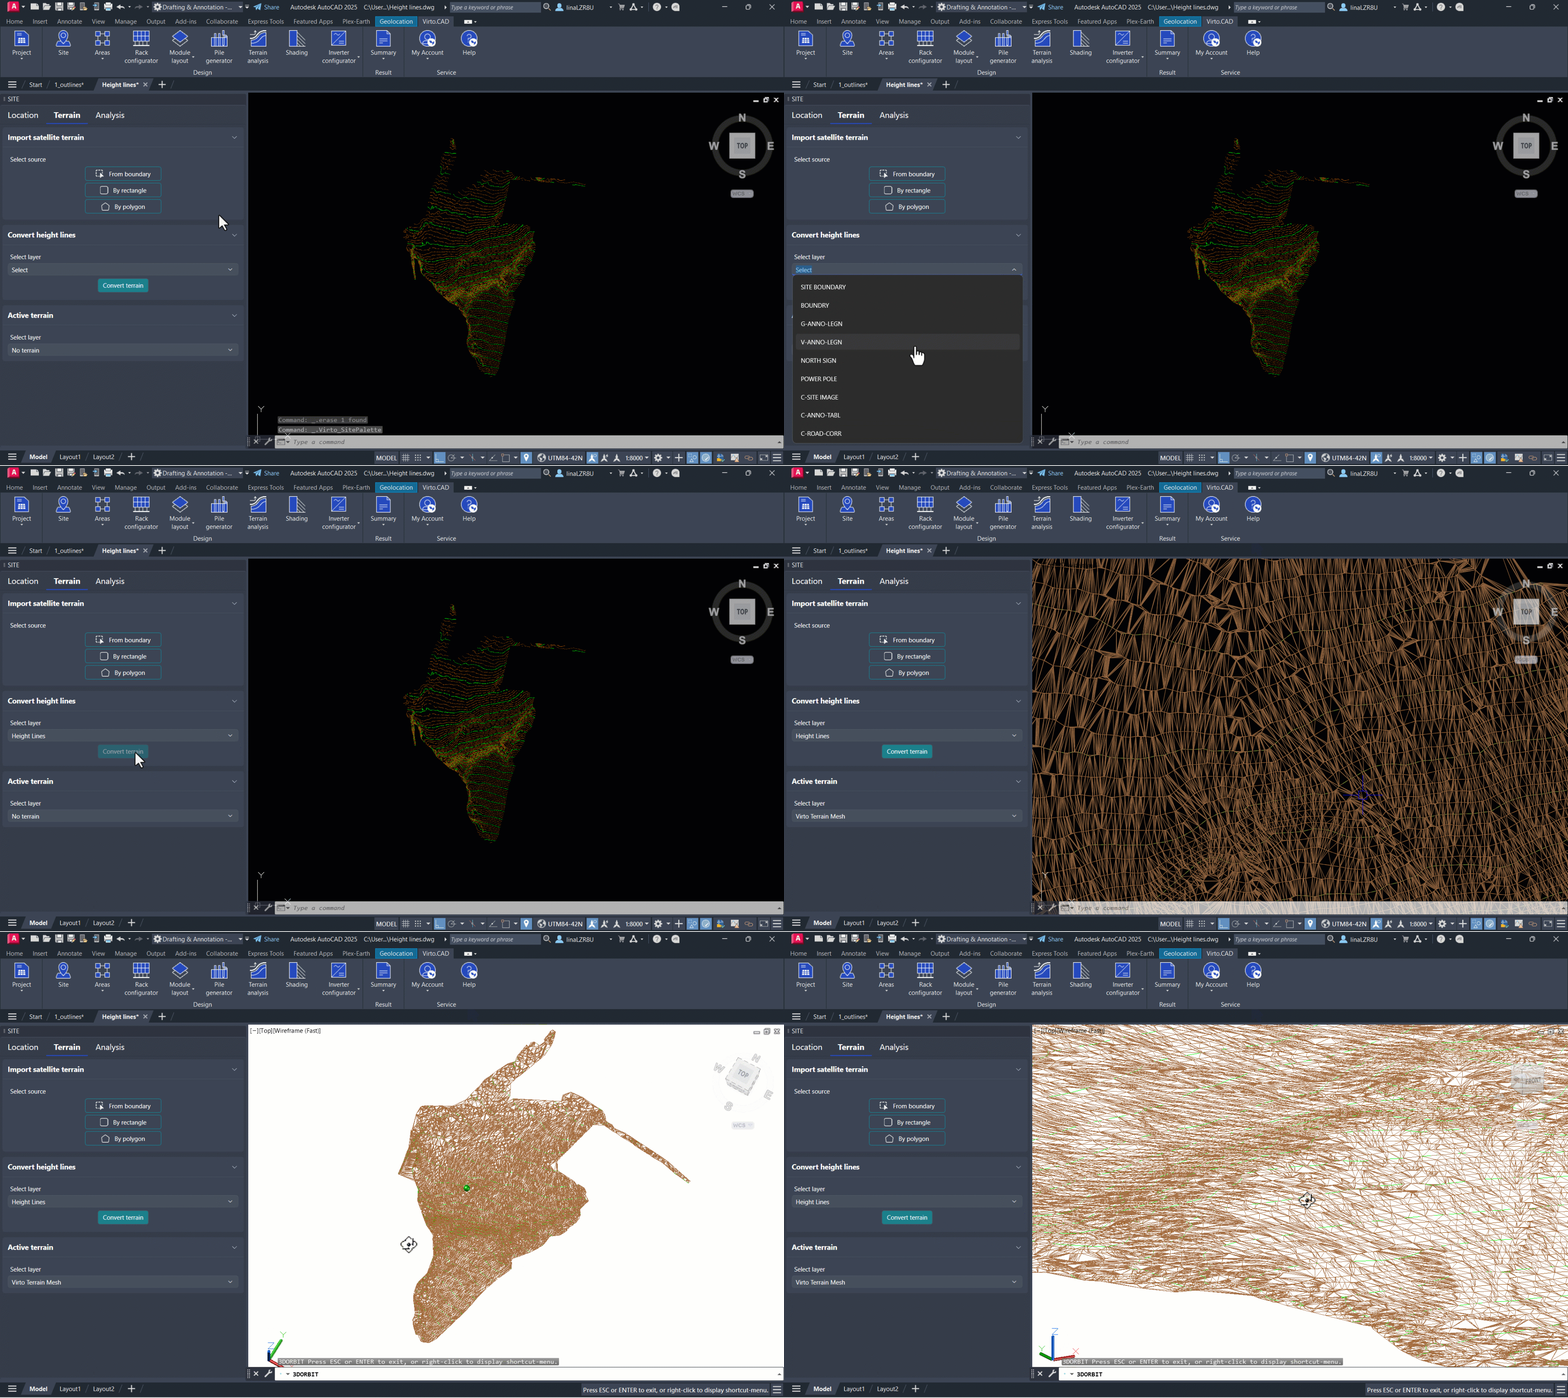
If your file contains more than one terrain, make sure the correct terrain layer is selected in the final Active Terrain section, as this is the one that will be used throughout the rest of the design process.
Note: If you want to change the grid size of your mesh, whether it comes from satellite terrain or your own topography, use the `VIRTO_SIMPLIFYMESH` command and specify the desired grid size. A new mesh will then be created.
Analysis
In the Analysis tab, you can analyze your terrain by Slope Angle or Slope Direction.
Slope Angle: Select the number of ranges you want to display, for example 6. These will be automatically divided into 6 ranges, but you can adjust the limits and change the color used for each one.
Slope Direction: The number of ranges is fixed at 8, but you can change the color used for each direction.
Click Load Analysis, then place your cursor over the terrain to display the result.
Data Source:
The following datasets are currently used:
- 10m Iceland DEM - CC-BY-4.0: Landmælinga Íslands
- 2022 UK LIDAR Composite - Open Government Licence v3.0: © Environment Agency copyright and/or database right 2015.
- 5m DEM Australia - CC-BY-4.0: Geoscience Australia
- 1m Estonian DTM - Elevation data: Estonian Land Board 2025
- 5m Estonian DTM - Elevation data: Estonian Land Board 2021
- 5m Spain DTM - CC-BY-4.0: Centro Nacional de Información Geográfica
- Bayern (Germany) 1m DTM - CC-BY-4.0: Bayerische Vermessungsverwaltung
- Belgium 20m DTM - CC-BY-4.0: National Geographic Institute
- Brussles DTM - CC-BY-4.0: National Geographic Institute
- Copernicus DEM GLO-30 - Produced using products © DLR e.V. (2014-2018) and © Airbus Defence and Space GmbH (2021) provided under COPERNICUS by the European Union and ESA, all rights reserved
- Denmark 1.6m DTM - Frie geografiske data: Dataforsyningen
- Digital Elevation Model (DEM) Austria 10m - CC-BY-4.0: Land Kärnten, data.gv.at
- EMOD 2024 Bathymetry - CC-BY-4.0: EMODnet
- ETOPO1 Global Relief Model - NOAA National Geophysical Data Center. 2009: ETOPO1 1 Arc-Minute Global Relief Model. NOAA National Centers for Environmental Information. Accessed 2021.
- Finland Elevation model 2m - CC-BY-4.0: National Land Survey of Finland, 2017
- France RGE ALTI 1m V2.0 - Licence ouverte Etalab 2.0: IGN
- Flanders DTM - Agentschap Digitaal Vlaanderen
- GEBCO 2024 Bathymetry - Public domain: GEBCO
- Baden-Württemberg 1m DTM (Germany) - dl-de/by-2-0: LGL, www.lgl-bw.de
- Bayern 1m DTM (Germany) - CC-BY-4.0: Bayerische Vermessungsverwaltung
- Berlin 1m DTM (Germany) - dl-de/by-2-0: Geoportal Berlin
- Brandenburg 1m DTM (Germany) - dl-de/by-2-0: LGB
- Hamburg 1m DTM (Germany) - dl-de/by-2-0: LGV Hamburg
- Hessen 1m DTM (Germany) - Open Data Hessen
- Mecklenburg-Vorpommern 1m DTM (Germany) - CC-BY-4.0: LAiV
- Niedersachsen 1m DTM (Germany) - CC-BY-4.0: GeoBasis-DE/LGLN 2025, Data changed
- North Rhine-Westphalia 1m DTM (Germany) - dl-de/by-2-0: Geobasis NRW
- Rheinland-Pfalz 1m DTM (Germany) - dl-de/by-2-0: LVermGeoRP2025
- Sachsen 1m DTM (Germany) - dl-de/by-2-0: Geobasisinformation Sachsen
- Sachsen-Anhalt 1m DTM (Germany) - dl-de/by-2-0: LVermGeo Sachsen-Anhalt
- Schleswig-Holstein 1m DTM (Germany) - CC-BY-4.0: LVG SH
- Thüringen 1m DTM (Germany) - dl-de/by-2-0: GDI-Th
- Hong Kong 50cm DTM 2020 - Hong Kong Geodata Store Terms: Hong Kong Geodata Store
- Korkeusmalli 10 m 2018 - CC-BY-4.0: Maanmittauslaitos
- LINZ 1m Lidar - CC-BY-4.0: LINZ
- Mexico 5m DEM - Fuente: INEGI, Aguascalientes 2019
- National LIDAR Programme - Open Government Licence v3.0: © Environment Agency copyright and/or database right 2015
- Netherlands 50cm AHN4 DTM - CC0
- Norway 10m DEM - CC-BY-4.0: Kartverket
- OSNI (Northern Ireland) 10m DTM - Open Government Licence: Land & Property Services
- OSNI 10m DTM - Open Government Licence: Land & Property Services
- Scotland 2m LIDAR Composite DTM - OGLv2.0: Environment Agency
- Scotland 50cm LIDAR Composite DTM - OGLv2.0: Environment Agency
- SRTM V3 30m - NASA
- swissALTI3D 2m - © swisstopo
- The GEBCO_2021 Grid - GEBCO Compilation Group (2021): GEBCO 2021 Grid (doi:10.5285/c6612cbe-50b3-0cffe053-6c86abc09f8f).
- US 3DEP 1/3 arc-second and 1m - USGS 3D Elevation Program Digital Elevation Model
- Wales 1m and 2m LiDAR Composite DTM - OGLv2.0: Natural Resources Wales